Some cool facts about Ecology
• 75% of all animals are beetles.
• Cockroaches can live weeks without their head (and their heads can
stay alive without their bodies!).
• 70% of the world’s fresh water is stored in Antarctica’s ice.
• Homeowners use up to 10 times more toxic chemicals per acre than
farmers
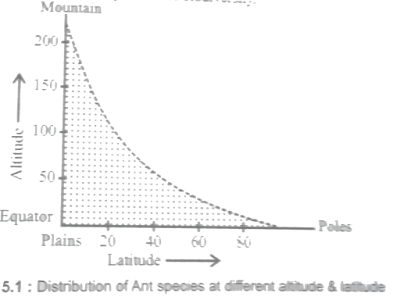
• In Peru a single bush may contain more ant species than in the British
Isles.
• A single porcupine is known to kill 100 trees in one winter
• Projections for the 21st century indicate that the earth's average
temperature will rise by anything between 1.4 and 5.8
Ecological pyramids:
(1) The number, biomass and energy of organisms gradually decrease from the producer level to the consumer level. This can be represented in the form of a pyramid called ecological pyramid.
(2) Ecological pyramid is the graphic representation of the number, biomass, and energy of the successive trophic levels of an ecosystem.
(3) The use of ecological pyramid was first described by Charles Elton in 1927.
(4) In the ecological pyramid, the producer forms the base and the final consumer occupies the apex.
(5) There are three types of ecological pyramids, namely:
(i) The pyramid of number:
The number of individuals at the trophic level decreases from the producer level to the consumer level. That is, in an ecosystem the number of producers is far high. The number of herbivores is lesser than the producers. Similarly, the number of carnivores is lesser than the herbivores.
(i) In a cropland ecosystem: In croplands the crops are more in numbers. The grasshoppers feeding on crop plants are lesser in number. The frogs feeding on grasshopper are still lesser in number. The snakes feeding on frogs are fewer in number.
Crop -> Grasshopper -> Frogs -> Snakes -> Hawks
(ii) In a grassland ecosystem: In grassland the grasses are there in large numbers. The consumers decrease in the following order.
Grass -> Grasshopper -> Lizard -> Hawk
Grass -> Rabbit -> Fox -> Lion
(iii) In a pond ecosystem: The number in a pond ecosystem decreases in the following order.
Phytoplankton -> Zooplankton -> Fishes -> Snakes
(b) The pyramid of biomass:
Biomass refers to the total weight of living matter per unit area. In an ecosystem the biomass decreases from the producer level to the consumer level.
(c) Pyramid of energy:
The energy flows in an ecosystem from the producer level to the consumer level. At each trophic level 80 to 90% of energy is lost. Hence the amount of energy decreases from the producer level to the consumer level. This can be represented in a pyramid of energy level to the consumer level. This can be represented in a pyramid of energy


