Pattern of Biodiversity
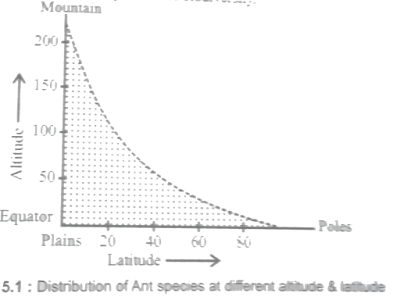
Biodiversity varies with the change of altitude and latitude.
· The species diversity Is maximum in plants (low altitude) and equator (low latitude).
As we move from lower to Higher latitude (from equator to poles) or from lower to higher altitude, the biological diversity Decrease. The diversity also depends upon seasonal variability and physical environment like temperature, humidity etc.
Thus the diversity of animals and plants is not uniform throughout the world and shows uneven patterns.
There 2 specific patterns of biodiversity
1. Latitudinal pattern The species diversity is the maximum at equator and decrease as move towards poles.
The tropical diversity is highest between latitudinal ranges of 23.5°N to 23.5"S.
For Example
· Columbia near) equator, has about 1400 species of birds,
· while New York (41◦N) and Greenland (71°N) have 105 and 56 species only.
· A forest of tropical regions, like Ecuador, has ten times more species of vascular plants as in the forest of temperate region, like mid-west USA.
· Amazon rain forest of, S. America, has tl1e greatest biodiversity on earth, And has about 30.000 species of fishes, 1300 species of birds, about 400 each of amphibians,
Reptiles and mammals, and 1,25,000 species of invertebrates. There are about 2 million species of insects and about 40,000 species of plants.
2. Altitudinal Gradient The impact of altitude is significant on type of biodiversity. Mostly the increasing altitude leads to decrease in only biodiversity as only some species can adapt the conditions prevailing at high altitude.
Following graph gives the clear idea this relationship
3. Species -Area relationship
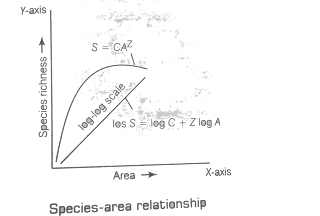
The German naturalist and geographer, Alexander Von Humboldt, while exploring SouthAmerican jungles, observed that species - richness increased with increasing explored area, but only up to a limit.
This relationship between species richness and explored area is a rectangular hyperbola described by the equation - S = C Az
Where
S is species richness
C is Y-intercept A is area and z is the slope to the line ( regression coefficient). .
On logarithmic scale, the relationship is a straight line, described by the equation - Log S=Log C+Z log A
Ecologist have discovered that value of ‘Z’ always lies in the range of 0.1 to 0.2, irrespective of the taxonomic group (angiosperms, fish or bird), or the region /geographical area.
But if we consider a large area (i.e., whole continent) , the Z-value in the range of 0.6 to 1.2)


0 comments:
Post a Comment